
There is no single right number of throws for a velocity day. Forty throws can be too few when you are fresh and too many when you are carrying fatigue. Coach Clayton Thompson's answer is to stop counting and use a velocity drop-off instead. You warm up fully, find today's peak velocity, then keep throwing until your velocity falls a set percentage below that peak. Peak at 90 mph with a 6 percent drop-off and the session ends near 84.6 mph, whether that takes 15 throws or 35.
What is a velocity drop-off in a throwing program?
A drop-off is a stopping rule. Instead of writing "30 throws" on the plan, you write "throw until you are 6 percent below today's best." Thompson builds his throwing programs around this idea in his long essay on managing training fatigue, and he credits the drop-off concept to Dan Buchenholz's training book [1, 2].
Two details make it work. First, the drop-off is measured from today's peak, not your personal record. A pitcher who tops out at 88 on a tired day should stop relative to 88, not relative to the 92 he hit last month. Second, the peak has to come after a real warm-up. Thompson is clear that the first throw is not the time to go all out. You build up through your normal routine until you find the day's true top speed [1].
Why a fixed throw count misses the point
Thompson calls set throw counts arbitrary [1]. A fixed number cannot know how you slept, how hard yesterday's lift was, or whether you are coming off a long weekend of games. The same 40 throws can be a light day for one pitcher and a heavy one for another. Even for the same pitcher it can change from week to week.
A drop-off adjusts on its own. When you are fresh, you hold your speed longer and naturally get more quality throws. When you are tired, you hit the line sooner and stop. Coaches call this autoregulation, meaning the plan adjusts to what your body can do today. That is the same idea behind fitness-fatigue models of training. Zatsiorsky describes every session as adding a slow, lasting fitness gain and a faster, shorter-lived dose of fatigue, so how ready you are on a given day depends on both [5].
Does stopping before deep fatigue work? What lifting research shows
There are no published trials testing velocity drop-offs in pitchers. The closest evidence comes from the weight room, where bar speed plays the same role velocity plays on the mound.
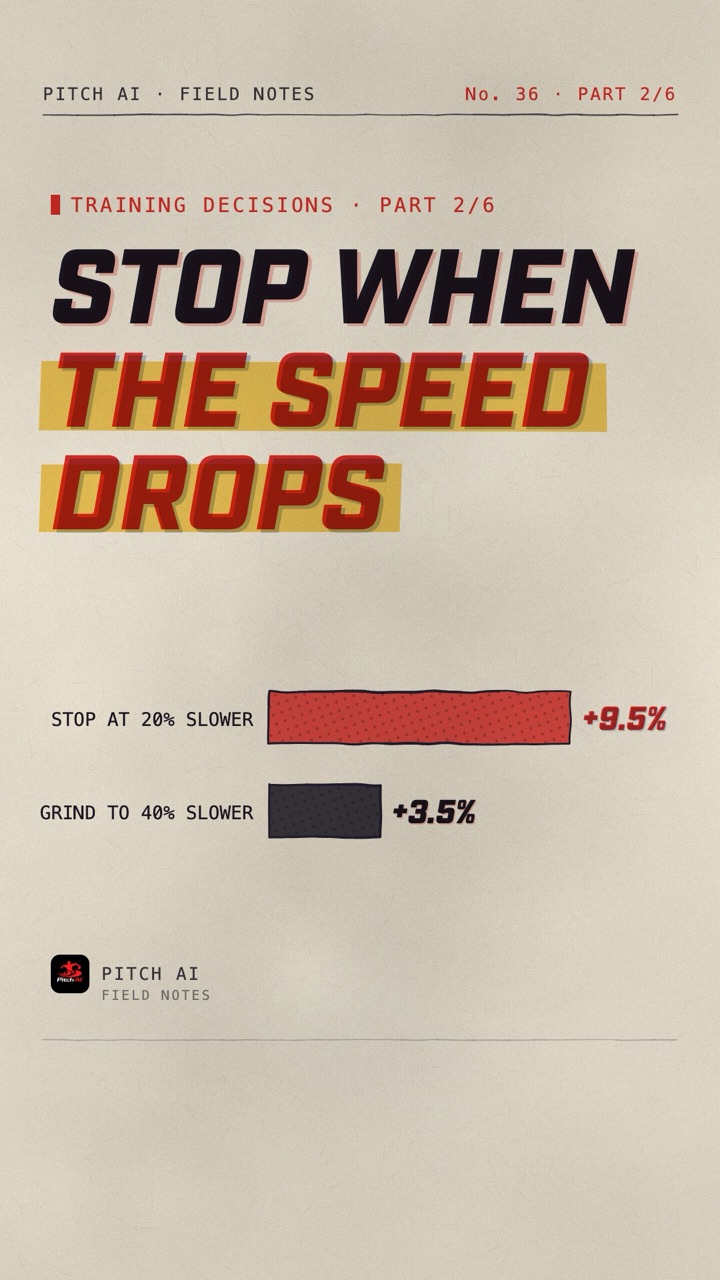
In an eight-week squat study, Pareja-Blanco and colleagues had 22 young men end each set once bar speed fell 20 percent or keep going until it fell 40 percent. Both groups gained similar squat strength. The 20 percent group improved its jump more (9.5 versus 3.5 percent) while doing about 40 percent fewer reps. The 40 percent group did gain more size in two of the thigh muscles, which matters if muscle size is the goal [3].
Autoregulation in general has decent support too. In Division I football players, six weeks of Bryan Mann's autoregulatory method (APRE), which sets the next set's weight by how many reps you just managed, improved bench press and squat strength more than a fixed linear plan [4]. We covered the bar speed side of this in why pitchers should measure velocity and track their lifts. The drop-off simply carries the same logic to throwing.
Watch the trend, not one day
Track your peak velocity over time
Pitch AI tracks your peak velocity trend and logs every strength session, so you can see whether your velocity days are moving the needle week to week.


What drop-off percentage should a pitcher use?
Thompson offers ranges that depend on how much recovery follows the session [1]. Treat these as a coach's rules of thumb. Nobody has tested exact throwing cut-offs in a controlled study.
| Drop-off | When Thompson uses it | What follows |
|---|---|---|
| 1 to 3% | Short recovery cycles, several throwing days close together | Back to work within a day or two |
| 4 to 6% | Frequency work, high-intent throwing spread across the week | Partial recovery between sessions |
| About 6%, up to 10% | Capacity work, one big session | Longer recovery before the next hard day |
He also describes a weekly version. In a frequency phase, a total drop of around 6 percent for the week is split across several days, such as 2, 1 and 3 percent. In the later phase, the same 6 percent can land in one session [1].
Frequency phase vs capacity phase
Thompson's programs run in two phases. The frequency phase spreads small drop-offs across about three high-intent days a week. Many pitchers have never thrown hard three times a week, so the frequency alone is a new stimulus. Fatigue builds up quietly underneath. Then the capacity phase packs one big drop-off into a single session, with more recovery days around it [1].
Thompson compares the built-up fatigue from the frequency phase to sandbags on a hot air balloon. Between the phases he uses a mini-deload of five to six easier days. As the sandbags come off, the athlete can reach higher speeds even though each capacity session is harder. In his programs, velocity tends to climb through the capacity phase and peak around weeks two to three [1]. That is his observation from coaching, not a study result, but it fits a long-known pattern. Zatsiorsky describes a delay of two to six weeks, about four on average, between a hard block of training and the performance it produces, with the gains showing up once the load comes down [5].
If you are planning the whole offseason, our article on how to plan a pitcher's offseason explains how blocks set each other up, and high and low days covers the rest of the week around your hard sessions.
When should a pitcher stop even if velocity holds?
Velocity is not the only signal. Thompson lists two more, and both can end a session before the number does [1].
- Mechanics change. If the delivery starts to look different, such as the front side flying open or the arm dragging, fatigue is showing up as compensation.
- Command falls apart. A pitcher can hold velocity while losing the ability to locate. Thompson reads that as fatigue too.
- Anything hurts. Pain in the elbow or shoulder ends the session immediately. See a qualified clinician rather than pushing to the drop-off.
How to run a drop-off session, step by step
- Do your full warm-up and build-up throws.
- Throw until you find the day's peak. Use the same device, the same drill and the same distance each time so the readings compare fairly.
- Work out your stop line. Multiply the peak by 0.94 for a 6 percent drop-off, or by 0.96 for 4 percent.
- Keep throwing with full rest between reps until you cross the line, or until mechanics, command or pain end it first.
- Log the peak, the number of throws and how the arm felt. Over weeks, the trend matters more than any single day.
A drop-off needs a trustworthy velocity reading. If you do not have one, a fixed, conservative throw count with honest effort ratings is the safer default. Do not guess at velocity.
Common drop-off mistakes
- Measuring from your personal best. That turns every tired day into a short day and every great day into an overload. Use today's peak.
- Letting a fresh day become a huge spike. A 6 percent drop-off can take far more throws than you are used to on a great day. Cap the session near your recent normal so a good day does not double your workload. Part 1 of this series explains why sudden spikes are the risk to avoid.
- Using big drop-offs without a base. Capacity sessions belong after weeks of built-up throwing, not as the first thing a pitcher tries.
- Skipping the recovery days. The capacity phase only works if the days around the big session stay easy.
This approach suits pitchers who already have a throwing base, usually older high school, college and pro arms. Younger pitchers should follow Pitch Smart's pitch counts and rest rules, and save drop-off based velocity work for later.
This article is part 2 of our Training Decisions series. The other parts cover part 1 on how much risk a pitcher should take in training, part 3 on whether old school training methods still work, part 4 on how to choose exercises that keep paying off, part 5 on how college pitchers should train from fall to winter, and part 6 on what pitchers can learn from wrestlers about mobility.
Frequently asked questions
How many throws should a pitcher make on a velocity day?
There is no fixed right number. A drop-off approach lets the athlete throw until velocity falls a set percentage, often 4 to 6 percent, below the day's peak after a full warm-up, so the count adjusts to how fresh the pitcher is. [1]
What is a velocity drop-off?
It is a stopping rule. You find today's peak velocity after warming up and stop once your throws fall a chosen percentage below it. For example, a 6 percent drop-off from a 90 mph peak ends the session near 84.6 mph. [1, 2]
Should the drop-off be based on my personal record?
No. Thompson measures drop-offs from the peak of that session, not from a personal record, so the rule adjusts to how ready you are on the day. [1]
Fatigue you can see
Keep your velocity and lifting in one place
Pitch AI tracks your peak velocity trend and logs every strength session, so the frequency and capacity phases of your plan show up as numbers, not guesses.
References
- Thompson C (2025). Understanding and Managing Training Fatigue: From Theory to Practice. Medium (blog), January 25, 2025. https://medium.com/@cl4ytonthompson/understanding-and-managing-training-fatigue-from-theory-to-practice-11bf3d4acf05
- Buchenholz D (2004). The Best Sports Training Book Ever. Inno-Sport Publishing. (Drop-off concept as cited by Thompson; not read directly.)
- Pareja-Blanco F, Rodríguez-Rosell D, Sánchez-Medina L, et al. (2017). Effects of velocity loss during resistance training on athletic performance, strength gains and muscle adaptations. Scandinavian Journal of Medicine and Science in Sports, 27(7), 724-735. https://doi.org/10.1111/sms.12678
- Mann JB, Thyfault JP, Ivey PA, Sayers SP (2010). The effect of autoregulatory progressive resistance exercise vs. linear periodization on strength improvement in college athletes. Journal of Strength and Conditioning Research, 24(7), 1718-1723. https://doi.org/10.1519/JSC.0b013e3181def4a6
- Zatsiorsky VM, Kraemer WJ (2006). Science and Practice of Strength Training, 2nd ed. Human Kinetics. (Two-factor fitness-fatigue model; delayed transformation of 2 to 6 weeks.)