
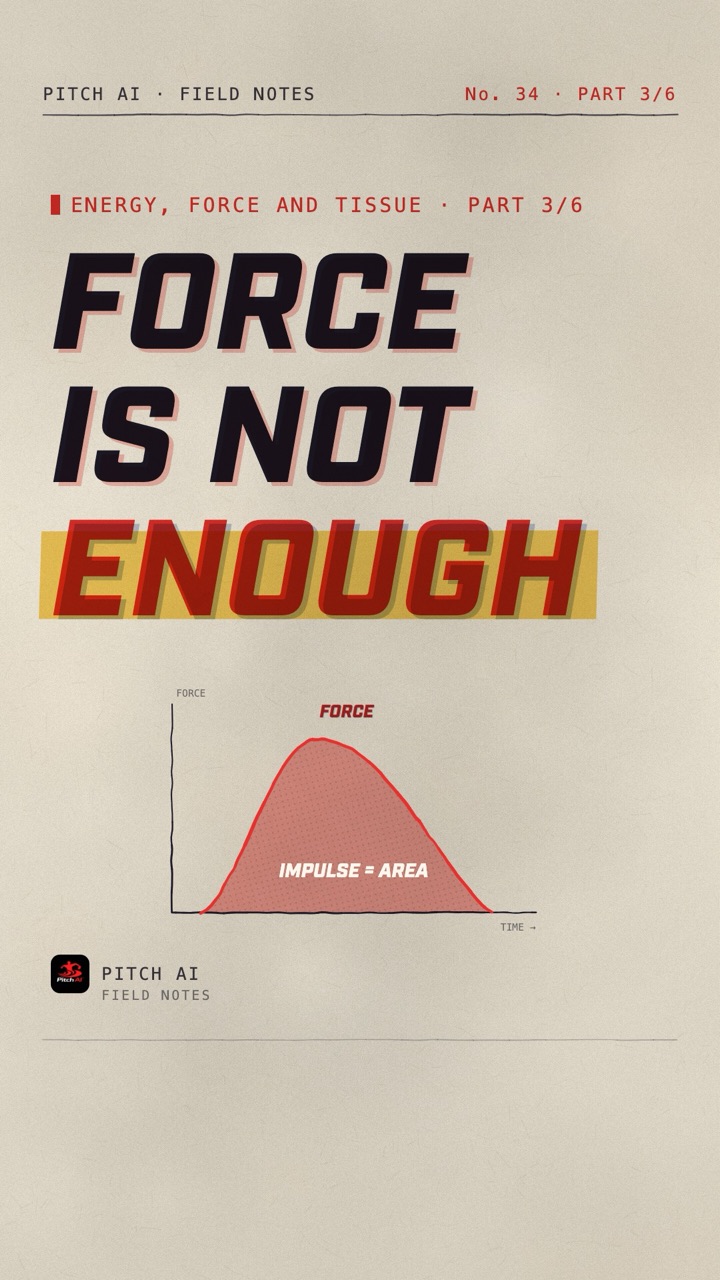
Impulse is force multiplied by the time you apply it. On a force-time graph, it is the area under the curve, and it equals the change in momentum of whatever you push, your body or a baseball. That is why impulse predicts performance better than peak force. In one jump study, impulse per kilogram correlated 0.93 with jump height while peak force actually trended the wrong way [3]. For pitchers, impulse explains how strength, speed of force and push time all feed velocity, and it gives a simple way to choose what to train.
What is impulse in simple terms?
Shove a loaded sled and it barely moves. Keep driving into it and it picks up speed. A big force for a short time, or a smaller force for a longer time, can produce the same change in speed. Physicists call the product of the two impulse, written J = F × t. The impulse-momentum relationship says J equals the change in momentum (mass times velocity). Since the mass of your body or a ball does not change mid-throw, more impulse means more speed [2].
Brice Crider, a performance coach who has worked in Driveline's lab, calls impulse "the king of performance metrics" [1]. His point is that most of sport comes down to changing the momentum of your body or an object, quickly, and in the right direction. Impulse is the quantity that does exactly that.
Why impulse beats peak force for jump height
Tyler Kirby and colleagues had 10 college-aged men with jumping experience do squat jumps and countermovement jumps from five set depths plus their own chosen depth. Relative net vertical impulse (impulse per kilogram of body mass) correlated with jump height at r = 0.93 for both jump types. Peak force correlated at about −0.40 [3].
Why negative? A deeper dip lowers the peak force you can hit but gives you more time to push, so the area under the curve can grow even as the peak drops. Only ten people took part, so treat the exact numbers carefully. The physics, though, is not in doubt. Jump height is set by takeoff velocity, and takeoff velocity is set by net impulse.
Three ways to get more impulse
Crider, drawing on Dan Cleather's book Force, lists three ways to make the area under the curve bigger [1, 5]:
- Taller: raise peak force with more strength and better leverage positions.
- Steeper: raise the rate of force development, how fast you get to high force.
- Wider: apply force for longer. This is the hardest one in sport, because most movements happen under tight time limits.
Vladimir Zatsiorsky's classic text explains why the time limit matters. Reaching true maximal force usually takes 0.3 to 0.4 seconds or more, while many sport actions are over much sooner [6]. He describes a young lifter whose squat went from body weight to twice body weight while his jump rose from 40 to 60 cm. Two more years took the squat to three times body weight, yet the jump stopped improving, because the rate of force development, not maximal force, had become the limit [6]. Strength builds the ceiling. At some point, how fast you can use it decides the outcome.
Train the whole curve
Get strength and power blocks built for you
Pitch AI's strength program builds your lifting and power blocks for your experience level, so heavy work, jumps and throwing fit together in one week.


Sprinters show the time squeeze
Running shows how little time sport gives you. Peter Weyand and colleagues tested 33 runners whose top speeds ranged from 6.2 to 11.1 meters per second. The fastest runners did not swing their legs into place any faster (swing time did not differ). They applied about 1.26 times more average force to the ground relative to body weight during each foot contact [4].
When contact time shrinks, the only way to keep the impulse is to push harder and sooner. Pitching works the same way. The time between front foot strike and release is short, so the qualities that let you produce big force quickly matter a great deal.
How impulse applies to a baseball
The ball obeys the same law. Momentum is mass times velocity, so getting a 0.145 kg baseball from rest to 100 mph (44.7 m/s) takes about 6.5 newton seconds of impulse from the hand, delivered in a fraction of a second. At 90 mph it is about 5.8 N·s. In part 1 we worked out the energy side of the same pitch.
Ball weight changes the push. A heavier ball accelerates more slowly, so the hand stays on it longer and the release speed is lower. A lighter ball leaves sooner and faster. Crider sees that as one reason varied ball weights are useful. Each one asks for a different force-time strategy [1]. He also suggests that more layback and horizontal abduction lengthen the path over which the hand can push the ball, widening the curve. That is a reasonable application of the physics rather than a measured result, and Blazevich makes the same general point about longer ranges of motion in throwing events such as the shot put [2]. Our weighted ball guide covers the risk and dosing side.
How should pitchers train the whole force-time curve?
Think of your training menu as tools for different parts of the curve. This mapping is coaching reasoning built on the physics above, not a tested prescription:
| Training tool | Part of the curve it mostly targets | Example |
|---|---|---|
| Heavy strength work | Taller (peak force) | Trap bar deadlift, split squat, 3 to 5 reps |
| Jumps, bounds, med ball throws | Steeper (rate of force development) | Countermovement jumps, rotational scoop tosses |
| Heavier throwing implements | Wider (longer push) | Overload balls at controlled intent |
| Lighter implements and full-intent throws | Steeper and faster | Underload balls, pulldowns in a velocity block |
Most pitchers have one obvious gap. A long, skinny athlete who jumps well but cannot squat much likely has room on the "taller" side. A strong athlete with a slow, grinding jump may need the "steeper" side. Crider frames it as finding the lowest hanging fruit while keeping what the athlete already does well [1].
Sample week for the off-season (example template, not a prescription)
- Day 1: jumps and med ball throws first, then heavy lower body strength.
- Day 2: lower intent catch play and mobility.
- Day 3: higher intent throwing, then upper body and trunk strength.
- Day 4: recovery work.
- Day 5: bounds and lighter, faster lifts, then moderate throwing.
For how to balance hard and easy days around this, see the best weekly training schedule for pitchers.
What should you test, and how often?
If you have access to a force plate, jump impulse and jump height are your friends. If you do not, jump height from a simple jump mat or phone app is a good stand-in, because height comes straight from impulse. Crider prefers impulse-based numbers over a single peak power reading, since one instant on the curve is noisier than the whole area [1]. Test every three to four weeks under similar conditions, and compare the trend with your throwing velocity rather than reading one day in isolation. Our article on why pitchers should measure velocity and track their lifts explains how to keep that data honest.
Common mistakes
- Chasing one peak number: peak force or peak power alone can mislead, as the jump study showed.
- Only lifting heavy: strength raises the ceiling, but at some point speed of force becomes the limit [6].
- Only doing fast work: a weak athlete has little force to apply quickly. Build both.
- Forgetting direction: impulse is a vector. Force has to go where you want the body or ball to go, which is why the lead leg block and trunk rotation matter.
More from the Energy, Force and Tissue series
This article is part 3 of our Energy, Force and Tissue series. Each part takes one idea from physics or tissue science and turns it into a training decision.
- Part 1: How much energy is in a 100 mph fastball?
- Part 2: Does your arm create velocity or pass it on?
- Part 4: How long does it take tendons to get stronger?
- Part 5: Should pitchers back squat?
- Part 6: Does your infrasternal angle decide your pitches?
Frequently asked questions
What is impulse in sports?
Impulse is force multiplied by the time it is applied, which is the area under a force-time curve. It equals the change in momentum of the body or object, so it decides how fast you jump, sprint or throw [2].
Is impulse or peak force better for predicting jump height?
Impulse. In a study of 10 jumpers, impulse per kilogram correlated 0.93 with jump height, while peak force correlated about −0.40 [3].
How can athletes increase impulse?
By producing more peak force, reaching high force sooner (rate of force development) or pushing for longer. Sport usually limits the time available, so force and rate of force development matter most [1, 5].
How much impulse does it take to throw 100 mph?
About 6.5 newton seconds. A 0.145 kg ball moving at 44.7 m/s has a momentum of 6.5 kg·m/s, and the hand has to supply that much impulse.
Do faster sprinters move their legs faster?
Not in the air. In 33 runners, the fastest applied about 1.26 times more ground force relative to body weight, while leg swing time did not differ [4].
Force times time
Build the curve behind your fastball
Pitch AI's strength program builds your lifting and power blocks for your level, and your velocity trend shows whether the work is reaching the mound.
References
- Crider B. Impulse: The King of Performance Metrics. Crider Performance blog (practitioner article). https://www.bricecrider.com/blog/impulse-the-king-of-performance-metrics
- Blazevich AJ (2017). Sports Biomechanics: The Basics. Optimising Human Performance, 3rd ed. Bloomsbury. Chapter 5.
- Kirby TJ, McBride JM, Haines TL, Dayne AM (2011). Relative net vertical impulse determines jumping performance. Journal of Applied Biomechanics, 27(3), 207-214. https://doi.org/10.1123/jab.27.3.207
- Weyand PG, Sternlight DB, Bellizzi MJ, Wright S (2000). Faster top running speeds are achieved with greater ground forces not more rapid leg movements. Journal of Applied Physiology, 89(5), 1991-1999. https://doi.org/10.1152/jappl.2000.89.5.1991
- Cleather D (2021). Force: The Biomechanics of Training. (Cited as summarized by Crider.)
- Zatsiorsky VM, Kraemer WJ (2006). Science and Practice of Strength Training, 2nd ed. Human Kinetics. Chapter 2.