
Mostly, your arm passes velocity on. In an analysis of 17,942 tracked pitches, the amount of energy transferred through the shoulder and elbow explained about 60% of the differences in pitch speed, while the energy the arm muscles added or soaked up explained almost none [1]. Peer-reviewed lab studies point the same way. The arm acts less like an engine and more like a cable. That has a cost, too. More energy through the elbow also means more elbow torque, and how much torque each pitcher pays for the same energy may matter for arm health.
What can a joint do with energy?
Power at a joint is the joint's torque multiplied by how fast it is turning. In the lab, researchers use motion capture and force plates to work backward from the movement to those torques, a method called inverse dynamics. Then they ask what each joint is doing with energy at every instant [1]:
- Generating: the muscles around the joint add energy to the chain, like a motor.
- Absorbing: the muscles take energy out, like a brake.
- Transferring: energy simply moves across the joint from one segment to the next, like a cable passing a pull along.
Adam Bloebaum, a biomechanics analyst, split shoulder and elbow energy into those three parts for every pitch between front foot strike and ball release, the window when the arm does its work [1]. Energy is power added up over time, so he could report both the peak rate and the total joules that moved through each joint.
What 17,942 tracked throws showed
Bloebaum used throws from motion capture assessments at Driveline Baseball. He kept only game-intent pitches with a regulation baseball, thrown in the athlete's normal delivery and over 70 mph [1].
| Group | Pitches |
|---|---|
| Youth athletes | 7,900 |
| College athletes | 6,876 |
| Professional athletes | 3,166 |
| Thrown 90 mph or harder | 2,169 |
| Thrown 70 to 80 mph | 6,218 |
The headline result was simple. The peak and total energy transferred through the shoulder and elbow explained roughly 59% to 62% of the variation in pitch speed. Measures of how much energy the arm generated or absorbed, and of when the peaks happened, mostly explained 0% to 7% [1]. What the shoulder passed on, the elbow passed on too. Total shoulder transfer predicted total elbow transfer almost perfectly.
One caution before going further. This is a blog analysis, not a peer-reviewed paper, and the numbers are correlations across a large mixed group of pitches. They tell you what tends to go together, not exactly what would happen if one pitcher changed one thing.
Do peer-reviewed studies agree?
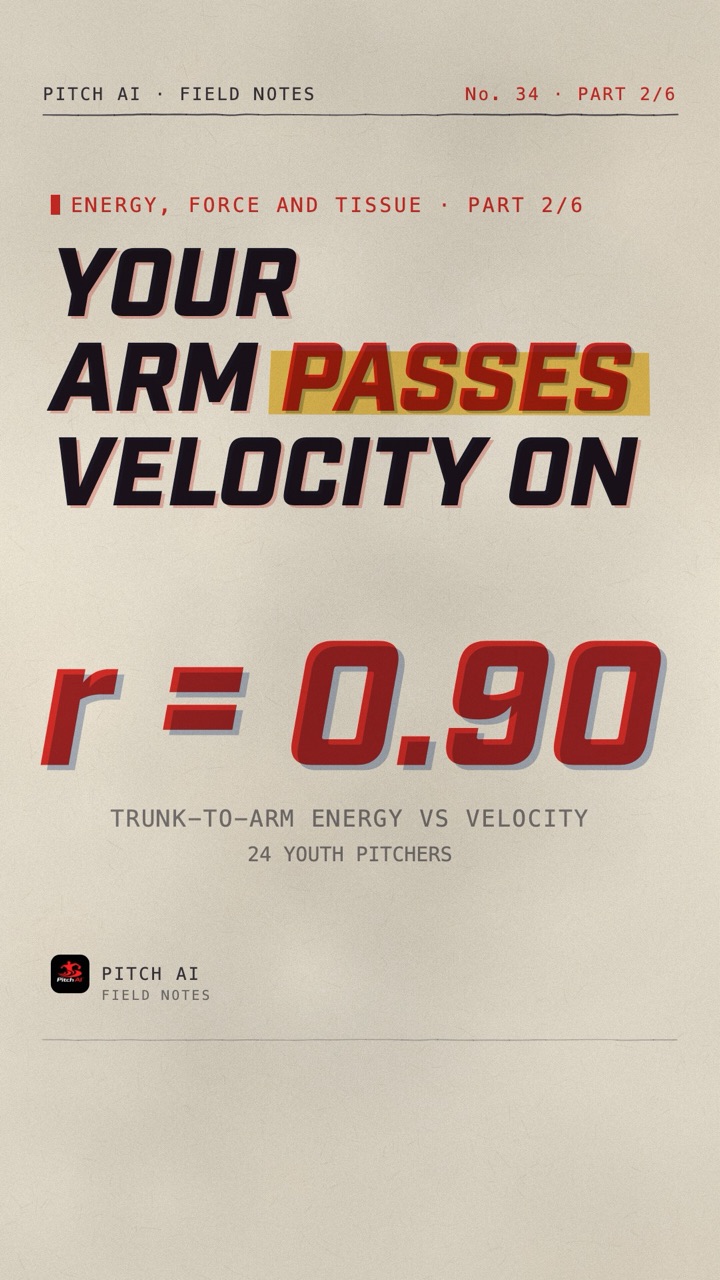
Largely, yes. In a 2019 study of 24 youth pitchers, Jacob Howenstein and colleagues measured energy flow through the whole body on an instrumented mound. The energy flowing from the trunk into the arm had the strongest relationship with pitch speed of any variable they looked at, with a correlation of 0.90 [2].
Arnel Aguinaldo and Rafael Escamilla compared 16 professional and 15 high school pitchers. Trunk rotation timing and trunk power were the only predictors of ball speed in their model. Trunk power, trunk timing and upper arm power together predicted peak elbow valgus torque [3]. The pros threw harder and had higher raw elbow torque, but once torque was scaled to body size, the two groups did not differ.
Notice one nuance. Bloebaum found that timing inside the arm explained very little, yet Aguinaldo found that trunk rotation timing mattered. Both can be true. How well the trunk loads the arm may matter more than fine timing between the shoulder and the elbow.
See your own chain
Put your delivery on video
Pitch AI's AI Video Review breaks down your delivery with cues and top fixes, so you can see whether your trunk is leading and your arm is following.


The price of more energy is elbow torque
Elbow valgus torque is the twisting load that tries to open up the inside of the elbow during the throw. The ulnar collateral ligament, the UCL that Tommy John surgery repairs, is one of the main structures resisting it. In Bloebaum's data, peak energy through the elbow explained about 73% of the variation in peak valgus torque. Pitch speed on its own explained about 50% [1].
That makes physical sense. More energy flowing through a joint needs more internal force to keep the joint together. It is also why velocity and arm stress tend to rise together, a pattern covered in our guide to what actually matters in pitching mechanics. The goal is not to avoid energy. It is to build an arm that can carry it.
Can a pitcher move the same energy at less cost?
Energy did not explain all of the torque. After Bloebaum removed the effect of pitch speed, the leftover torque still related to the leftover elbow energy (r² of 0.34, or 0.47 for peak transfer), but plenty remained unexplained [1]. Some pitchers moved a lot of energy at a lower elbow cost than others.
Bloebaum suggests that gap may be where a lot of elbow risk lives, and that future work should look for the joint positions and timing that make a delivery "cheaper" without lowering velocity. That is an untested idea. He also points out that every pitcher was run through the same body model, with segment masses estimated from cadaver data, which adds error to the torque numbers [1].
Why muscling up the ball does not help
Coaches have told pitchers for decades not to "muscle up." The energy data give a reason. If arm generation barely relates to speed, extra arm effort mostly adds tension. Bloebaum argues that a forearm and shoulder held tight through the throw lose some of the quick stretch and recoil that tendons are good at [1]. Blazevich explains the underlying physics. A stretched tendon recoils far faster than muscle can shorten, so the fastest parts of a throw lean on recoil rather than raw contraction [4].
Driveline's Hacking the Kinetic Chain makes a related observation about the trunk. A big change in trunk flexion between layback and release is a sign that energy is leaking, and cleaner transfer reduces stress on the arm, particularly the elbow [5].
How do you train for better energy transfer?
- Make more energy where it belongs: legs, hips and trunk. Lower body and trunk strength and power work feed the chain. See what training actually transfers to velocity.
- Keep the arm connected and loose: in our view, drills where the body moves first and the arm follows, such as rocker throws and step-behinds, fit the data better than cues that tell the arm to work harder.
- Train the arm to hold the load: shoulder and forearm strength, done consistently, raises the load the tissue can carry. Our arm care routine lays out a week.
- Ramp throwing volume gradually: more energy per throw means the acute-to-chronic workload ratio matters more, not less. See pitching workload and arm health.
- Check it on video: look for the trunk leading and the arm following, and for a trunk that keeps its posture from layback to release. Our guide on why video review matters shows what to film.
Common mistakes
- Chasing arm speed with arm effort: the data say the arm's own work explains little of velocity.
- Treating sequencing as a stopwatch: fine arm timing explained almost nothing in the large dataset. Trunk power and how well it reaches the arm explained much more.
- Reading correlations as rules: these studies describe groups. They do not prove that one change in one pitcher will move the needle.
- Forgetting the bill: every extra joule through the elbow is load the UCL and forearm muscles have to handle. Pain means stop and see a clinician.
More from the Energy, Force and Tissue series
This article is part 2 of our Energy, Force and Tissue series. Each part takes one idea from physics or tissue science and turns it into a training decision.
- Part 1: How much energy is in a 100 mph fastball?
- Part 3: What is impulse and why does it matter for pitchers?
- Part 4: How long does it take tendons to get stronger?
- Part 5: Should pitchers back squat?
- Part 6: Does your infrasternal angle decide your pitches?
Frequently asked questions
Does the arm generate velocity in pitching?
Mostly no. In 17,942 tracked pitches, energy transferred through the shoulder and elbow explained about 60% of speed differences, while energy the arm generated or absorbed explained 0% to 7% [1]. The legs and trunk produce most of the energy, and the arm passes it on.
What is energy transfer in pitching?
It is energy moving from one body segment to the next across a joint, for example from the trunk into the upper arm and then the forearm. Researchers separate it from energy that the muscles at a joint add (generation) or remove (absorption) [1].
Does more velocity mean more elbow stress?
Usually. Energy moving through the elbow explained about 73% of elbow valgus torque in one large analysis, and pitch speed alone about 50% [1]. Some pitchers appear to move the same energy with less torque, but that idea is still untested.
What predicts pitch velocity in youth pitchers?
In a study of 24 youth pitchers, energy flowing from the trunk into the arm had the strongest correlation with pitch speed, at r = 0.90 [2].
Velocity flows through the arm
Build a delivery that passes it on
Pitch AI's AI Video Review breaks down your delivery with cues and top fixes, and your throwing program ramps workload so the arm can carry more energy over time.
References
- Bloebaum A (2025). Energy Flow Dynamics in Pitching. Blog analysis of 17,942 Driveline motion capture pitches, not peer reviewed. https://www.adambloebaum.com/blog/energy-flow-dynamics-in-pitching/
- Howenstein J, Kipp K, Sabick MB (2019). Energy flow analysis to investigate youth pitching velocity and efficiency. Medicine & Science in Sports & Exercise, 51(3), 523-531. https://doi.org/10.1249/MSS.0000000000001813
- Aguinaldo A, Escamilla R (2019). Segmental power analysis of sequential body motion and elbow valgus loading during baseball pitching: comparison between professional and high school baseball players. Orthopaedic Journal of Sports Medicine, 7(2), 2325967119827924. https://doi.org/10.1177/2325967119827924
- Blazevich AJ (2017). Sports Biomechanics: The Basics. Optimising Human Performance, 3rd ed. Bloomsbury. Chapter 17.
- Boddy K, Daniels M (2017). Hacking the Kinetic Chain: Advanced Pitching. Driveline Baseball.